User Interface
Measurement browser and data selector
The browser shows the opened projects and the corresponding measurements (in an expandable tree structure). The name of the measurement is composed of the measurement number, the measurement region and the flow rate. For easy selection of measurements, you can use the buttons below the browser (e.g. you can select all data for a certain flow rate).
Analyze button: The Analyze button plots all selected data either as raw data or using the filter settings.
Session tabs
Information tab
Shows all saved measurement properties. Several properties are only highlighted if a single measurement is analyzed. If properties differ between single measurements this is indicated by “(multiple)”. Use the scroll bars or adjust the pane or increase the size of the pane by dragging of the edge to see the full table.
General
- Cell Number:
- number of recorded cells. In ShapeIn this number is shown on the front panel “Number of cells measured”.
- Channel Width:
- dimension of the channel. This number is not detected automatically by the system, but has to be set by hand in ShapeIn on the front panel under “Channel dimension [µm]”.
- Flow Rate:
- is the sum of sheath and sample flow in µl/s. ShapeIn records this number when the measurement starts and shows it on the front panel under “Flow Rate [µl/s]”.
- Measurement Number:
- is the number of the measurement within the opened project. In ShapeIn this number is shown on the front panel under “current/next #”
- Region:
- shows the position of the Region-of-interest during the measurement. This is not detected automatically by the system, but has to be set by hand in ShapeIn on the front panel under “Region of interest in the …”.
- Sample Flow Rate and Sheath Flow Rate:
- are the flow rates of the sample and sheath flow in µl/s, respectively.
Image
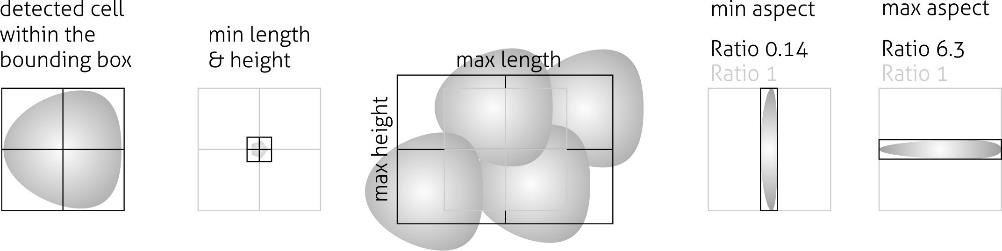
- Cell Aspect Max:
- gating parameter for maximum aspect ratio = length/height. Here, length defines the extension of cell in flow direction and the height the extension of the cell transverse to the channel.
- Cell Aspect Min:
- gating parameter for minimum aspect ratio = length/height. Here, length defines the extension of cell in flow direction and the height the extension of the cell transverse to the channel.
- Cell Max Height / Length / Min:
- shows the gate that was set in ShapeIn to exclude cells larger / smaller than this number. In ShapeIn these numbers are shown in the normal tab under Gating tools.
- Pix Size:
- resolution of the microscope-camera-system in [µm/pixels]. In ShapeIn this number is shown in the expert tab under Expert settings and “Resolution [µm/pix]”.
- Thresh:
- grey value used as a threshold for each pixel of the image after subtracting the background image. All pixels above the threshold form the binary image. In ShapeIn under Expert settings “min grey threshold”.
- Trig Thresh:
- minimum number of pixels within the binary image to be further processed in cell analysis. In ShapeIn under Expert settings “min pixels threshold”.
Framerate
- Frame Rate:
- of the camera during the measurement. ShapeIn records this information when the measurement starts and shows it in the Expert tab under Camera tools and “Framerate [Hz]”.
ROI
- Height / Width:
- of the region of interest in pixels. ShapeIn records this information when the measurement starts. It is set automatically or manually in the Expert tab under Camera tools and “Height [pix]”/ “Width [pix]”.
Filtering tab
In this tab, you can filter your data by excluding values beyond certain limits. Select the Enable Filters check box on the right and hit the Apply/Reset button to apply/reset the settings. The Box Filters limit the range of parameters; the Polygon Filters allow freely defining a gate by a polygon in the current plot. The filters are applied to the whole data set, independently of the actual shown plot. At least one event has to be within the limits or the program shows an error.
Box Filters
Minimum and maximum values for box filters are set to 0.0 by default. As long as min and max values equal 0.0, the filter is not applied. On the left of the table the minimum value is set, on the right the maximum. If you set a minimum, you have to set a maximum as well, otherwise all data points are gated out.
- Range Area:
- limits the cell size in [µm²].
- Range Area Ratio:
- defines the relative difference between convex hull area and cell area. “1”: convex hull and area contour are the same, “<1”: forbidden, because the convex hull cannot be smaller than the contour. The minimum value is only effective “>1”.
- Range Aspect:
limits the ratio of height and length of the bounding box around the contour of the cell (see Figure below).
- Range Defo:
- limits the deformation
- Range Pos Lat:
- limits the lateral position of a contour in the region of interest
- Range Pos x:
- limits the position in direction of channel axis in the region of interest
- Range Time:
- limits a number of time frames within the measurement in [s].
- Range x-size:
- limits the size in x direction (width)
- Range y-size:
- limits the size in y direction (height)
Polygon Filters
TODO: brief explanation; See the tutorial 1 for details.
Plot Window
Will be updated when new GUI is ready.